Data Integration
supOS boasts on the application of UNS (Unified Namespace), and here we use an example to show how supOS can integrate and use different types of data.
Example Description
We will use supOS to connect and format equipment running time, product quantity and product quality data, adopt AI model analyze equipment performance based on the OEE (Overall Equipment Effectiveness) metrics and send the result back to supOS for subsequent usage.
Data Source
- Equipment running time data connected and monitored by PLC through Modbus
- Order information from ERP system transmitted by RestAPI
- Product quality log recorded on an Excel table
In this example, we will use simulated data to demonstrate the process.
Data Integration
Building Data Models
Build data models to store data in supOS, and at the same time, MQTT topics with identical name will be created in the embedded MQTT broker.
- Log in to supOS, and the click Namespace under UNS.
- Click
 to add a folder (namespace) named Equipment.

- Click
 to add a file (data tag) named CNC under the Equipment, and add attributs to store equipment actual running time and planned running time data.

- Select Persistance for history data storage.

- Apply the same operation to add relational model Order/OrderInfo, Quality/OrderQualityLog, Quality/QualityAnalysis
| Model | Attribute | Description |
|---|---|---|
| Order/OrderInfo | sum/double, time/double | Indicates the quantity of products and the time consumption for making a single product. |
| Quality/OrderQualityLog | Sum/double, Good/double, Rate/double. | Indicates the overall quantity of products, quantity of certified products and certified rate. |
| Quality/QualityAnalysis | performance/string | Indicates the overall equipment performance. |

The data under attributes are mock data generated by supOS.
Adding Data Sources
When finishing building data models, NodeRed data flows with mock data will be generated in SourceFlow. We need to change the data sources of the flows to get real data.
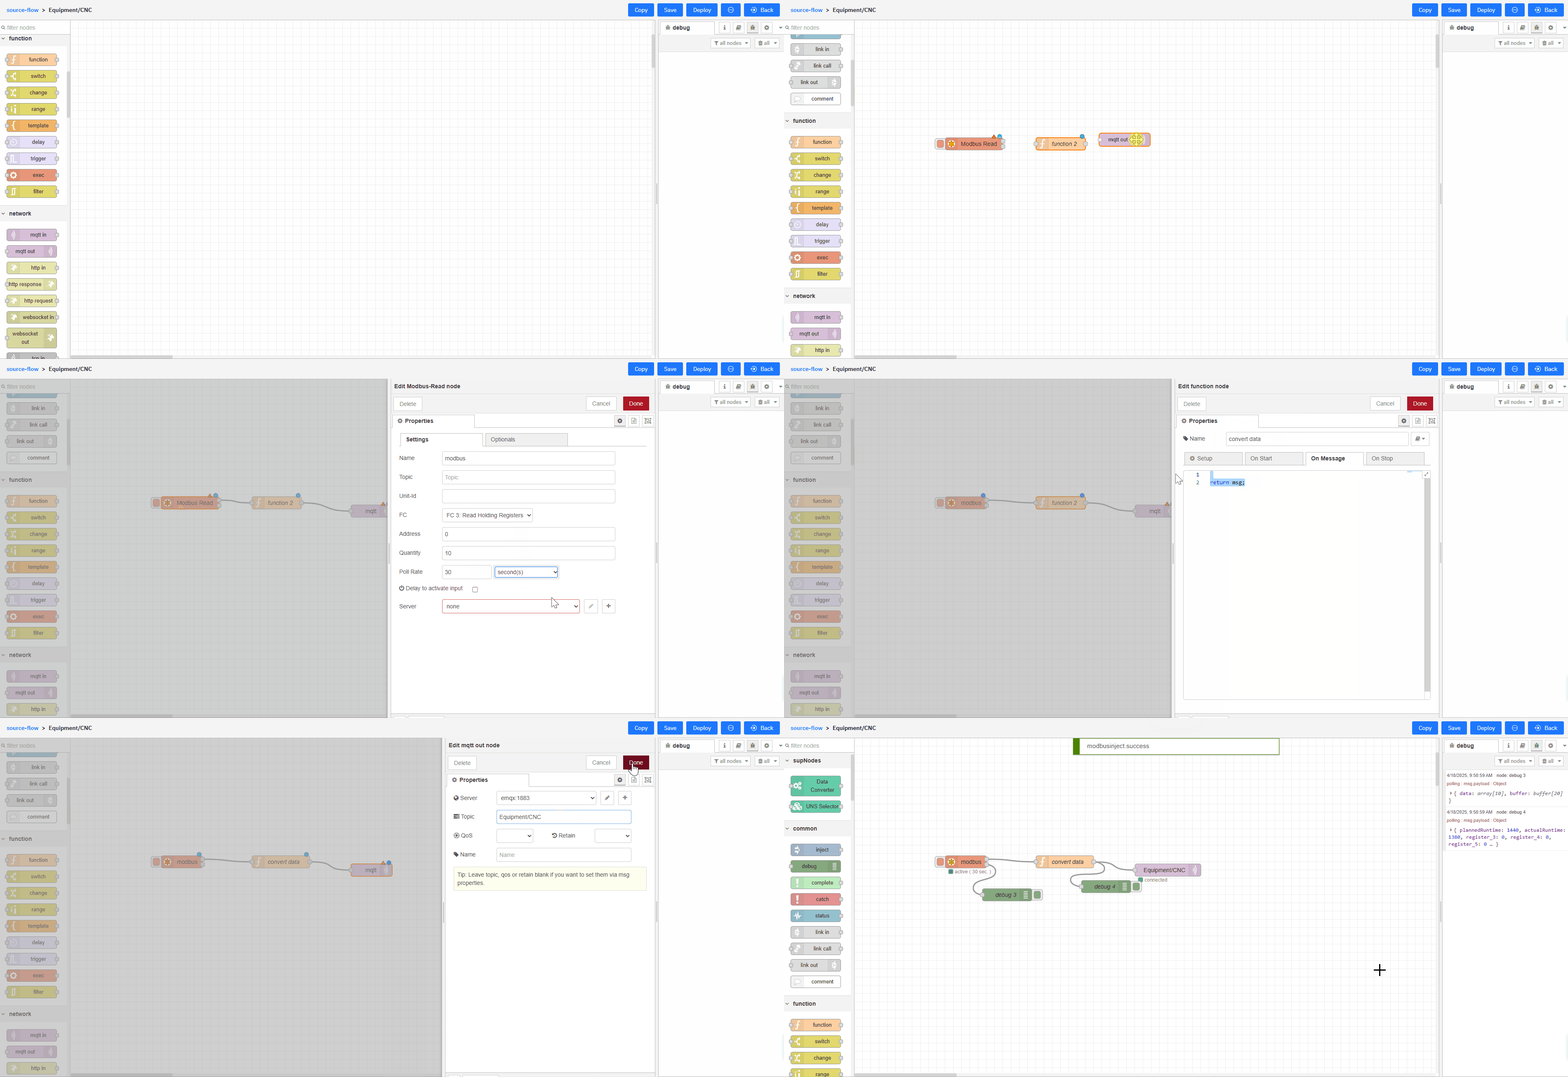
Getting Equipment Running Time
- Click SourceFlow under UNS, and then click Design under Equipment/CNC.

- Change the data source to Modbus, add the Modbus server and enter corresponding configurations.
- Add a function node, wirte a script to format the transmitted data to JSON object.
supOS can only decode JSON object data at present.
- Drag an mqtt out node, and set it to the embedded broker and subscribe to the topic corresponding to the model under UNS.
- Add Debug nodes for clear view, and then click the Modebus node to trigger the flow.

- Check whether the data is transmitted to Namespace.

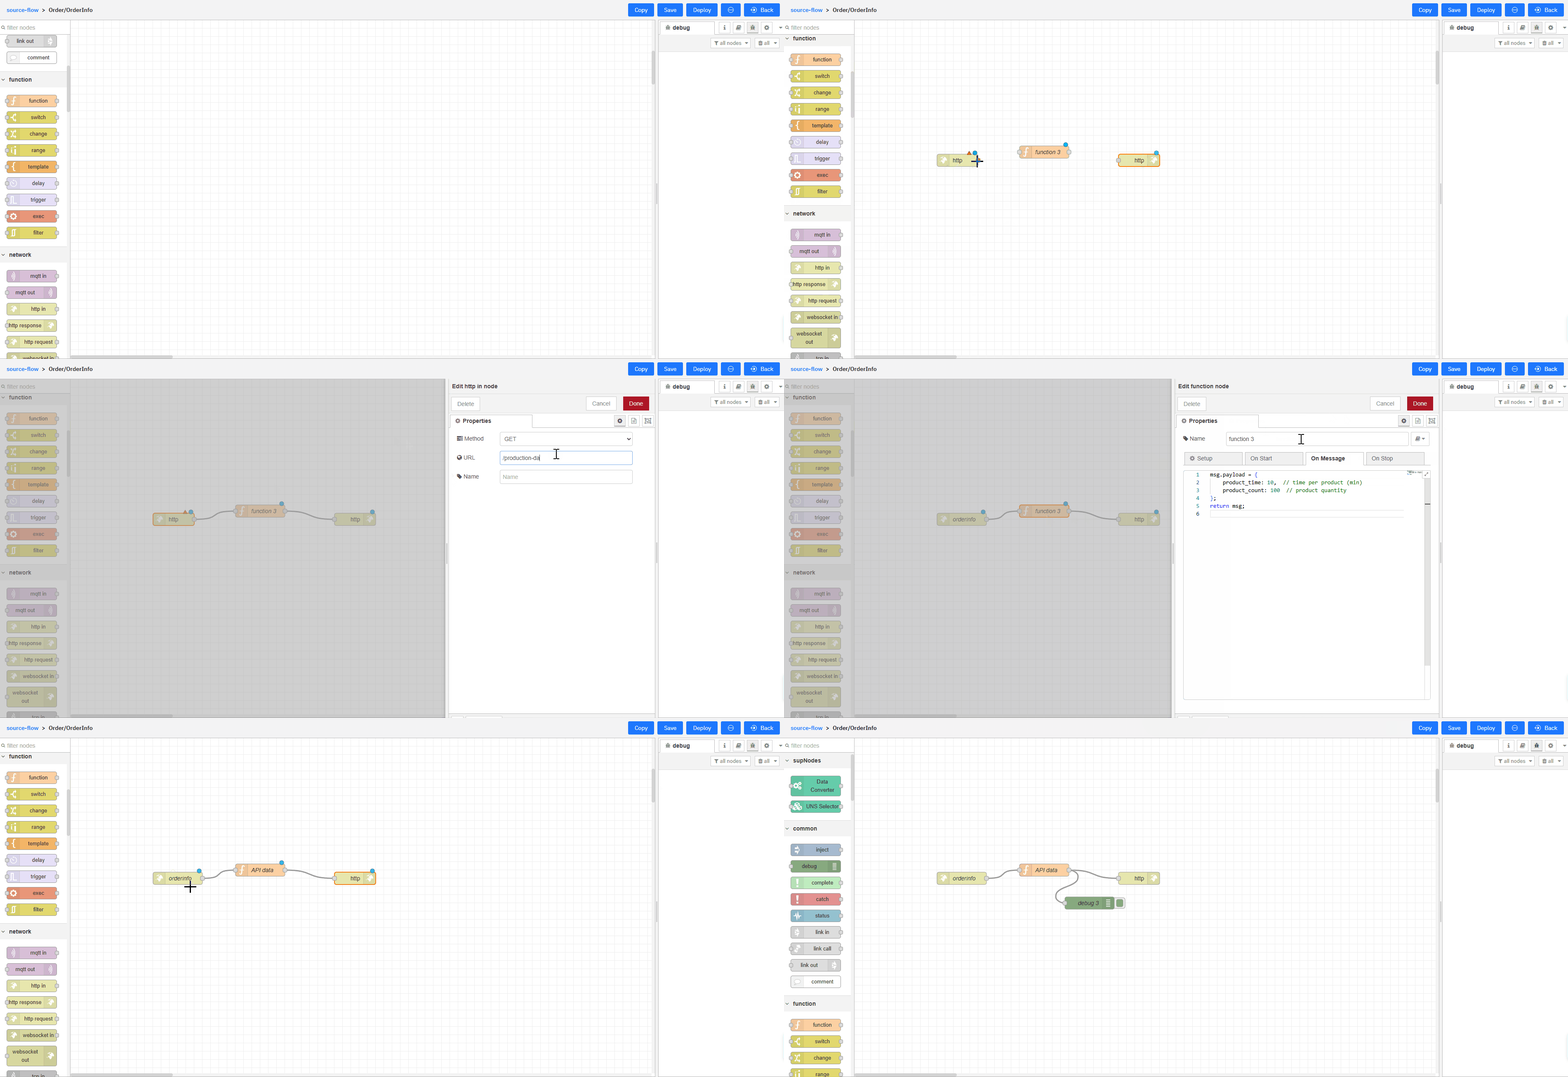
Getting Order Information
-
On the SourcFlow page, click Design under Order/OrderInfo.
-
Change the data source to RestAPI, and enter the API information.
In this case we build a simple API in NodeRed, which contains the data we need, to simulate the connection.
- Build a simple API.
- Call the API.


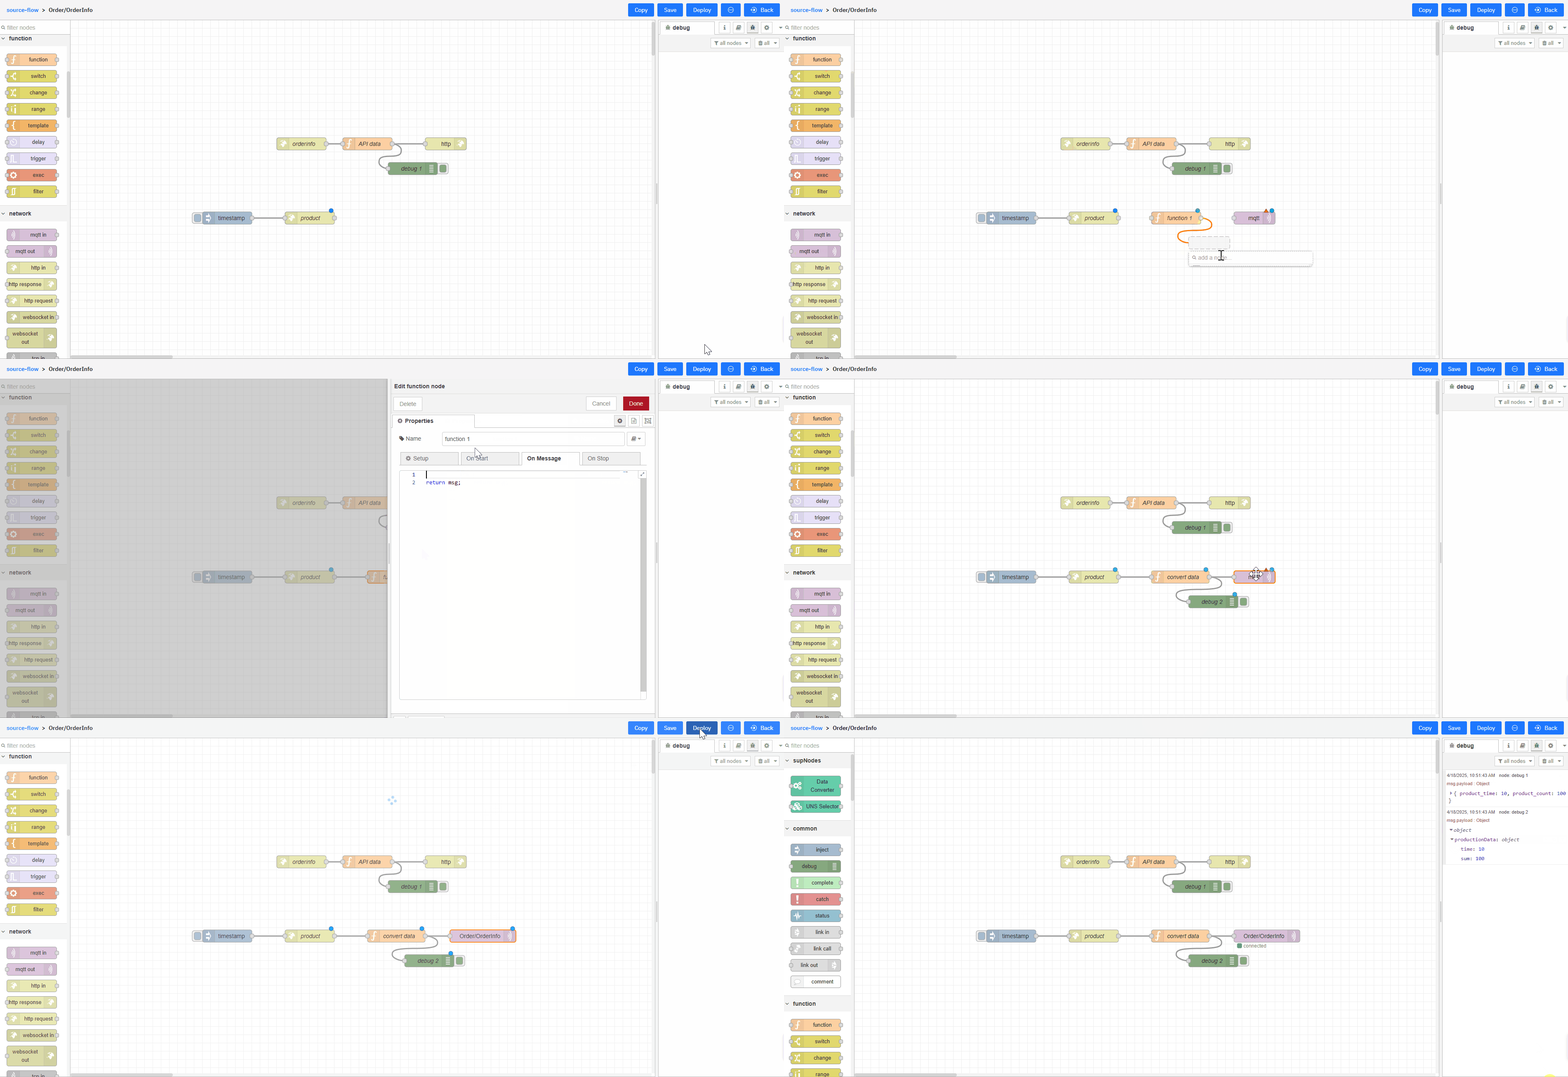
- Add a function node, wirte a script to format the transmitted data to JSON object.
- Drag an mqtt out node, subscribe to the topic.
- Add Debug nodes for clear view, and then trigger the flow.

- Check whether the data is transmitted to Namespace.

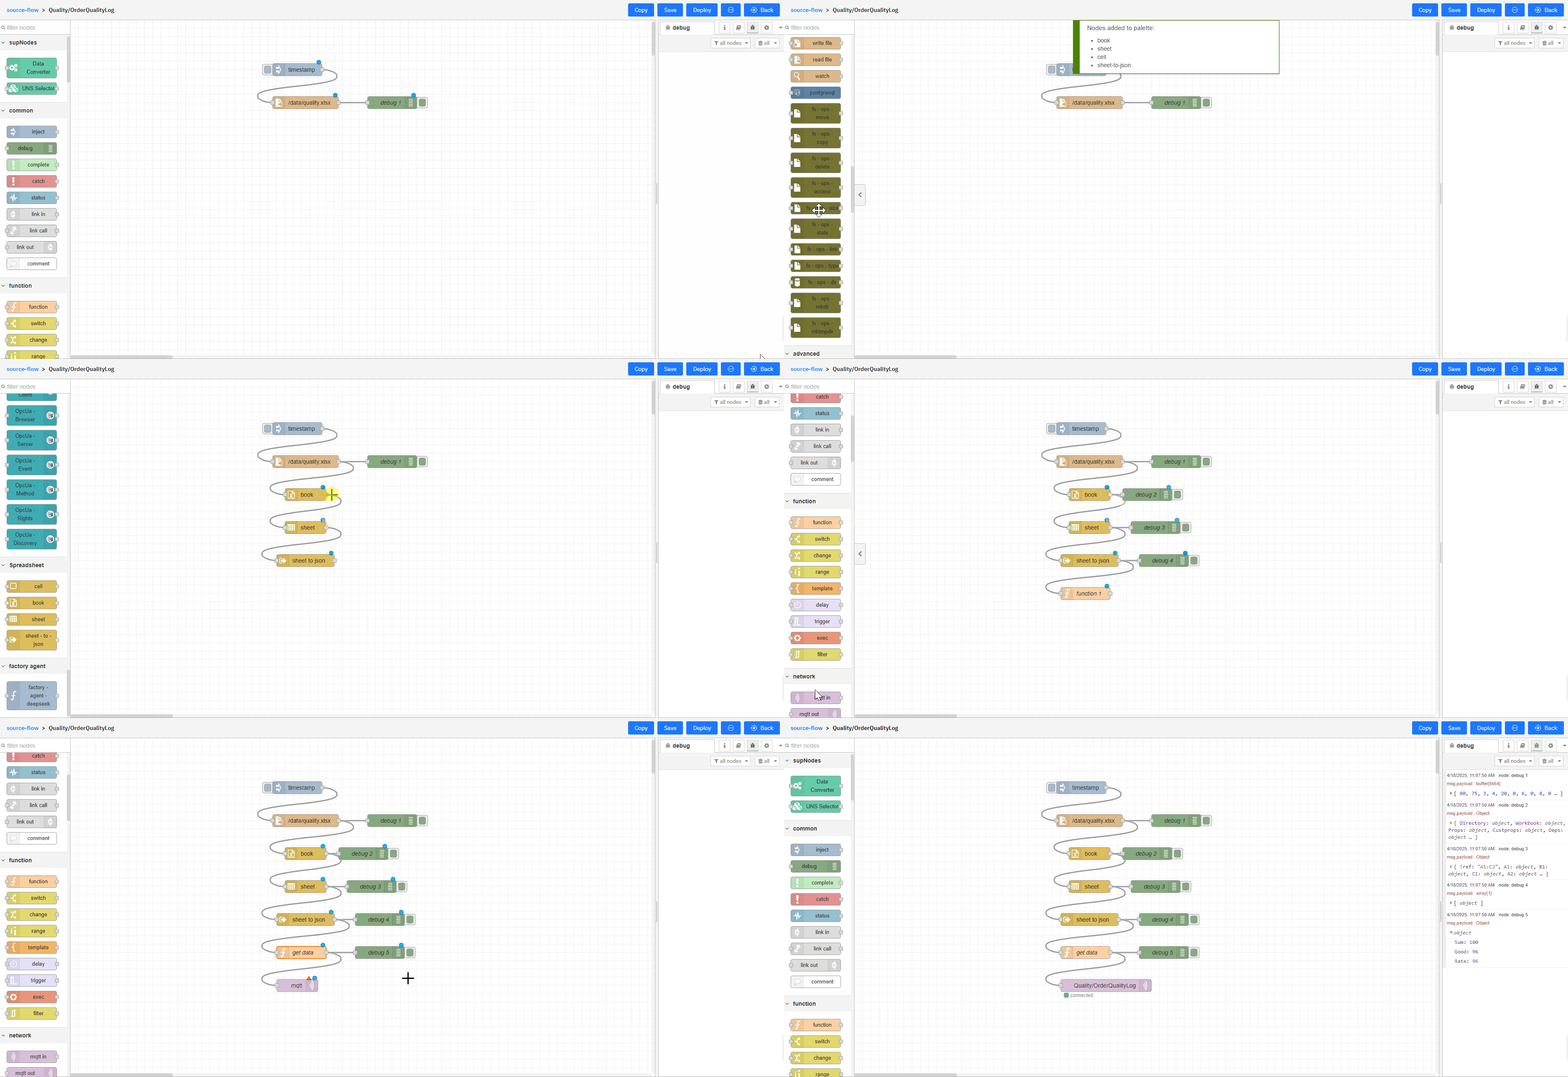
Getting Product Quality
-
Click SourceFlow under UNS, and then click Design under Quality/OrderQualityLog.
-
Change the data source to excel file.
- Save the Excel file to the server where the NodeRed is deployed.
- Use a read file node to access the Excel table.

- Extract the data from the Excel table.
You need to install node-red-contrib-spreadsheet-in node to extract data.
- Add a function node, wirte a script to format the transmitted data to JSON object.
- Drag an mqtt out node, subscribe to the topic.
- Add Debug nodes for clear view, and then trigger the flow.

- Check whether the data is transmitted to Namespace.

Analyzing Data
Integrates all data sources and analyze them with AI models, eventually sends the results back to Namespace.
- Click EventFlow under UNS, and then add an event flow.

- Click Design, and then drag 3 mqtt in nodes to the canvas.
- Double-click the nodes, add the embedded broker named emqx, and then subscribe to the topic Equipment/CNC, Order/OrderInfo and Quality/OrderQualityLog from Namespace.

- Install factory-agent-states and factory-agent-deepseek nodes, and connect all 3 data sources with factory-agent-states node to integrate all data.
These nodes are customized and uploaded to NodeRed. For details, see factory-agent-states and factory-agent-deepseek.
- Set the delay time to more than 10 seconds, and write the prompt for using Deepseek.
- Add a function node to write the agentstate parameter to received for the factory-agent-states node to output all cached topic messages.
factory-agent-states caches data transmitted to it after receiving all of them. It is better to give a reasonable delay time to receive all data before operation.


- Connect another function node to factory-agent-states to calculate OEE and better the prompt.

- Connect the factory-agent-deepseek node to the function, enter the Deepseek key and select deepseek-reasoner model.

- Add another funtion node to extract result information from the Deepseek response.
supOS Namespace has receiving data volume limit (256 bytes). We recommend you to split the response.

- Drag an mqtt out node, and subscribe to the topic Quality/QualityAnalysis.

- Trigger the flow in order and go to Namespace to check the result.
- Trigger all 3 data source flows under SourceFlow.
- Trigger the function node.

Set the triggering interval of all 3 data source flows and the state function flow shorter than the delay of the factory-agent-state node, to automatically run the whole flow.

Data Display on Dashboard
supOS combines Grafana to complete the flow of data collection, analysis and display.
- Add a function node in EventFlow to get the AI analysis result.

- Add another data model under Namespace to store the result.
- Go to System > Dashboards, and then add a new dashboard.
- Click Design on the dashboard card, and then click Add visualization.
- Select a data source.
- Time series data (Equipment/CNC) is stored in TDEngine.
- Relational data (Order/OrderInfo, Quality/OrderQualityLog) is stored in Postgresql.
- All data in Namespace is transmitted through MQTT broker.
If there is no MQTT, you can click Configure a new data source, search for it and configure it.


- Design the dashboard.

- Save the dashaboard and then click Preview.
